
Introduction
I recently decided I wanted to give back to the community. I was going to start a band, but I cannot sing and nobody likes the clarinet so I decided to write things about Digital Forensics and Incident Response (DFIR).
Well, months later, after that “give-back” decision, and with very little completed, I now have an even deeper respect for anyone in the DFIR community who has dedicated time to helping all of us. I am amazed they can hold a job, have a personal life, publish articles, and make tools at the same time. No need to name them; we all know who you are and are profoundly grateful….as you can tell by the one million views, two “likes”, and one comment on the things you post.
Since I cannot find the time to write up the article in-full, and because there is a general lack of information on the subject of Cloud Forensics and Incident Response (IR), I am going to start publishing it in pieces. I admit, this is a departure from the standard industry definition of the Incident Response Process. I just found it easier to organize this particular article.
We will start with the general location and description of Cloud IR data sources, then later follow it with articles on practical application in Amazon AWS and Microsoft Azure.
Please note this content will be supplemented and modified over time.
Also, to save time I will shamelessly borrow and cite from the leaders in our field. I am not compensated by anyone or anything referenced in this article; everything is there because it is my opinion and I would encourage you to add your thoughts, or even better…disagree and post your opinion in the comments. I firmly believe that we need more debate in this field.
Preparation
The good news…even if you are an absolute cloud-novice you can be successful on your very first cloud incident response. You will find that a simple Web search for any of the terms below will immediately hit on Amazon and Microsoft’s easy-to-read documentation, which are substantially better than the indecipherable hieroglyphs that software developers have produced for decades.
Incident Response Plan
Create an Incident Response (IR) Plan. IR Plans are not in-scope for this article but it is worth mentioning that you will likely fail if you have no plan at all. It is further recommended you have a specific section within your IR playbook covering cloud response, as it is not the same as on-prem incident response.
Environmental Discovery
Data Flow Diagrams
If possible, try to catch the unicorn…..network architectural diagrams. Just be aware that if the organization does not enforce the creation of diagrams then it is unlikely they will exist. In terms of cloud architecture, a company’s network design is like a snowflake; each of them is often a unique implementation so it is a little more difficult to make educated guesses than it would be for an on-premise environment. Luckily, AWS and Azure have automated discovery that may help you hone in on the pieces you need and not look like a cat chasing a laser pointer. Lastly, before you assume a data source is not available in your SIEM, do a quick (and very general) keyword search. Often the data source might have been added or it was added and incorrectly referenced/index.
Amazon (AWS)
AWS Network Manager – to view the network topology
AWS Config – monitors changes to the account’s system configuration
Azure (AZ)
Network Watcher – to view the network topology
Detection
Network Forensics
There are a number of great DFIR training sources. However, it is my opinion that SANS Institute is the gold standard. So for network-forensics I prefer to follow the general workflow from Phil Hagen’s outstanding FOR572 course in which he focuses on the primacy of the following network data sources:
1. Logs
2. NetFlow
3. Full Packet Capture (FPC)
I would like to add one more source…
4. Vendor Tools – we will cover EDR tools later, but this is more of a focus on vendor network tools that provide data under one of the three aforementioned data points.
Logs
NOTE: If cloud monitoring services tools are enabled and configured (e.g. AWS GuardDuty, MS Sentinel, Azure Identity Protection, etc), I recommend you spend your time gaining access to those tools rather than trying to pull the raw log sources listed below. Certainly try to aggregate your log visibility later, but the middle of an IR is not the time to try to add new sources into your SIEM.
AWS
Thankfully Amazon likes to standardize the naming structure due to the overwhelming number of AWS products and offerings.
CloudTrail – operations performed TO a cloud resource. These are the API logs and nearly every AWS resource interaction is an API call. So if you only have time to focus on one data source this is a good one.
CloudFront – this is the AWS method to push your data to the closest edge of your clients (i.e. a CDN service). But for DFIR, CloudFront is where you likely will find access logging (also look at the Elastic Load Balancers, which may be capturing access logs as well as producing flow logs).
CloudWatch – health and status, alarms/alerts. Your enterprise may be aggregating other log sources (like CloudTrail) here as well. Additionally, this is also a good metrics data source for suspected coinmining.
GuardDuty – cloud-specific automated thread detection and alerting. Really well done product if it is configured.
Detective – Automated analysis and consoles. Sort of a network-meets-endpoint EDR tool.
Azure
Microsoft calls the first three “platform logs”
Azure AD logs – User-based logs. Azure AD Sign-ins, changes, and flagged activity
Activity log – Resource-based logs. Write operations (e.g. PUT, POST, DELETE) performed TO an Azure resource (e.g start/stop a VM, create a webapp, delete an AZ storage account, etc).
Resource log – Also resource-based logs, but these are operations performed IN or BY a cloud resource. These are often host-based logging that are being shipped to the AZ control plane for easier viewing in the Azure admin consoles.
AZ Information Protection – M365 DLP solution
AZ Monitor – Automated analysis and console
MS Defender for Cloud – (formerly AZ Security Center) – A CSPM/CWPP solution with vulnerability assessment, remediation, and alerting capability. There is a lot more DFIR value in the MS Defender line of products and I plan on covering them in another article.
MS Sentinel – There is a lot of overlap with MS Azure security tools but essentially, this is the SIEM/SOAR.
NetFlow (NF)
AWS
VPC Flow Logs – NetFlow between the network interfaces.
Ask the admin if these logs are enabled and if they are going to 1) CloudWatch or 2) an s3 bucket (as .gz files).
The default AWS log format is:
${version} ${account-id} ${interface-id} ${srcaddr} ${dstaddr} ${srcport} ${dstport} ${protocol} ${packets} ${bytes} ${start} ${end} ${action} ${log-status}
Azure
Network Watcher – NetFlow between Network Security Groups
Full Packet Capture (FPC)
AWS
Traffic Mirroring – Can mirror packets (VXLAN format) to another VPC NIC where you have a listener set up, like on the Cloud IR VPC that you have already proactively setup with Bro/Zeek, Wireshark, or tcpdump instance? (hint…hint)
If Traffic Mirroring is not turned on and the infection is ongoing, have your cloud admin go to the AWS console and follow these instructions
Azure
Network Watcher – FPC between Network Security Groups (NSG)
Vendor Tools
Most mid-to-large size corporate environments have at least one EDR tool in their baselines that can provide useful IR data. The cloud offers a significant assortment of 3rd party solutions that may already be deployed in your enterprise, like Cisco StealthWatch Cloud or SolarWinds for netflow, or Niksun NetDetector for FPC. This is where your enterprise discovery efforts pay off.
Host Forensics
I am a fan of FOR500 and FOR508. Rob Lee and his fellow instructors have forgotten more about host forensics than I will ever know. Rob even invented the term “DFIR”. I have not invented anything. I thought I invented the frisbee when I was six years old. But my dad said I did not…the bellwether to a long life of disappointment.
Triage Data Collectors
Endpoint Detection and Response (EDR) tools
Do you have an endpoint security tool in your environment (e.g. Cortex XDR, Tanium, FireEye HX, SentinelOne, Crowdstrike Falcon, Cyber Triage, etc)? Most of the time, actionable intelligence can be obtained with a triage data acquisition. EDR tools allow you to focus on rapid acquisition of only the data you need. If you do not have an EDR tool on your endpoints, I recommend starting with Kroll’s open-source free tool, KAPE, created by DFIR Jedi, Eric Zimmerman. Specifically, I recommend picking a use case from the SANS 500 and 508 posters (i.e. Evidence of Execution, File Download, etc) and acquiring those artifacts first.
Incidentally useful tools in your baseline
Do not forget, incidental and “smoking gun” data points are often found in one of the non-DFIR enterprise tools (e.g. security compliance tools like Qualys, or antivirus tools like Symantec or McAfee)
Host Logs
Windows
Not in-scope for this article, but the main path for modern Windows computers is %WINDIR%\system32\winevt\Logs\* . Keep in mind there are many other log sources on a Windows machine beyond the event logs. It would be worthwhile to ask the server admin’s if there is any log-forwarding, or if the logs are in a non-standard location. For example, a commonly overlooked issue when acquiring server logs is the architects often put the primary application’s log (and sometimes the swapfile) on a separate partition. So if you are grabbing logs from the C volume, you may not notice that the E volume contains GB’s worth of application logs .
Linux
The main location is /var/log. I had a list of commands I liked, based on previous experience. Then I found this outstanding document written by Sandfly Security which I recommend you provide to the cloud sys admin and have them push the output to individual text files, named with the command they ran. Then, add those text files to the specific hostname folder under the main greppable folder structure you created for the incident. For example,
Folder:IncidentXYZ –> subfolder:Hostname1 –> filename:<PsAuxf>.txt)
For more information about the grep folder, see “Lessons Learned”
SANS also has a wealth of knowledge in this reference document
Containment, Eradication, and Re-Discovery
Not in-scope yet. Might add some things here in a future article.
Post-Incident Activity
Also not in-scope yet. Stop being greedy
My Lessons Learned
Here a few recommendation taken from my own failures:
- Enlist the sys admins. The most time-consuming piece of IR is the data collection. Time is working against you so try not to single-handedly acquire all the data sources; they exist in too many places for one person to handle. Draft the local administrators into the incident response (through their manager’s directive). The admins are probably better at querying/exporting their own logs than you are. Often, you can even request they provide the logs in a specific format and decimated to only what is relevant to you (but still with the widest net possible); most admins are pretty capable with command line tools. Now you can work with 1 GB of logs/netflow/pcap, rather than the 100GB they would send you.
- Use the telephone. While we are on the topic of slow response, become an innovator in your organization and call people on the telephone thing. You can waste hours, and often days, waiting for email replies from telephobic people, before you even start querying logs.
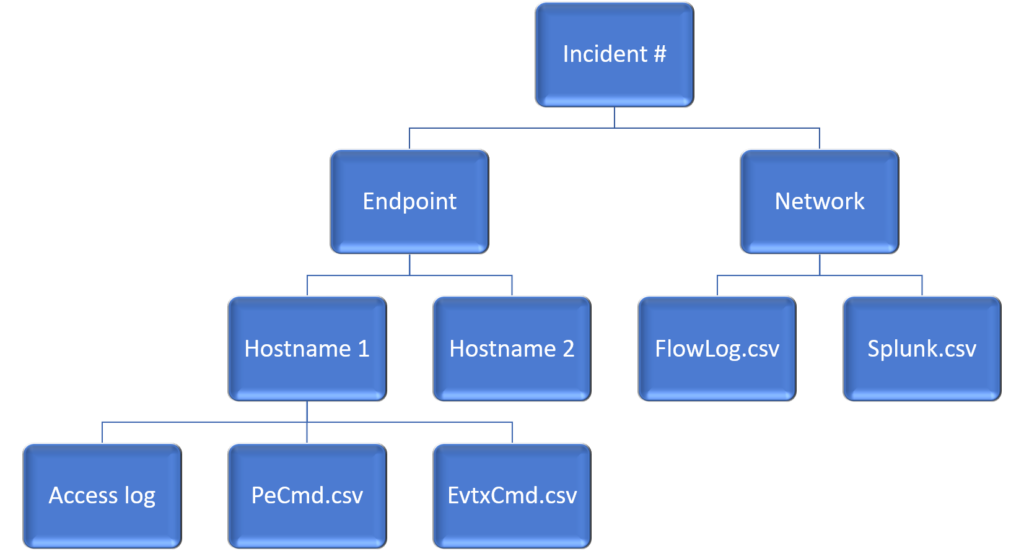
- Make a grep folder. If the IR is big enough, you are going to get a flood of data sources over hours or days. Consider making a central folder of all text-based logs and dump each log into a subfolder by the source name/hostname (e.g. <Incident #>\Host-Based Logs\<hostname 1>). Later, you can grep it all at once or use a SIEM to search it, like SOF-ELK or a local Splunk instance. The main value I have found with this method is you can rapidly grep the data and every hit has the source automatically listed in the path next to it, which is a problem when all the data you get is labeled “access.log1, access.log1[1]…..”.
A final lesson learned to finish this article. You will likely get a lot of files in various forms but the main one will be gzip’s. Simply using something like 7-zip to “unzip all” will almost certainly result in overwriting a lot of your files (e.g. multiple hosts with “access.log” or “bash.history”, etc.) And although normalizing all your files to a common format should be a step you take, in reality it is often too time-consuming to tailor a script for every incident response. So here is a quick command line to grep only the gzips without unzipping them.
find . -name “*.gz” -type f -exec sh -c "zcat {} | grep -iaE '<malicious IP>|<URL>' " \;

^^ edited this to allow for piped exec'ing and grepping of each file rather than across the whole output.