
Last major content update: 6 May, 2021
Introduction
This is the follow-on article to Incident Response in the Cloud – Part 1 where we will expand on practical application in Microsoft Azure.
Please note, Microsoft has several hundred cloud service offerings so this is not even close to a comprehensive Cloud IR plan. However, it is a good place to start for standard Azure Compute investigations.
Please note this content will be supplemented and modified over time.
As previously mentioned, I am not compensated by anyone or anything referenced in this article; everything is here because it is my opinion and I would encourage you to add your thoughts, recommendations, or even better…disagree, and post your opinion on LinkedIn. We all learn through debate and I would love to hear your ideas.
Terms
Tenant – A globally unique Azure AD instance, ending with onmicrosoft.com, representing an organizational entity
Management Group – A logical grouping to allow multi-subscription control. If the organizational entity has multiple AZ subscriptions, this would be the level that one could apply things like global corporate governance/compliance
Subscription – A high-level, multi-region-capable Azure logical grouping/container that can have a number of child groups or resources within it, but will only be associated with one AD tenant.
Resource Group (RG) – This is the common container for resources themselves. For example, one may put VNets, VM’s, gateways, NIC’s, etc. in a single resource group.
Network Security Group (NSG) – equivalent to a network layer firewall or you can picture it as a set of ACL rules. Good for controlling traffic between subnets. For externally-facing assets, an AZ Firewall, AZ Gateway, and/or an Application Gateway are better choices, as they are L3/L4 with extra things like NAT’ing.
“What the heck is Azure <blank> service?!”
By the time you learn about a new Azure service, there will be a newer Azure service. The bright side is that if you need to understand anything related to Azure, a simple Web search will immediately hit on Microsoft’s documentation. My deepest thanks to them for making clear overviews, walkthroughs, and (my personal favorite) amazing free hands-on training [Example of their excellent training].
Search terms for whichever Azure service’s documentation:
site:docs.microsoft.com <your term>
Search terms for free practical application training:
site:docs.microsoft.com/en-us/learn <the thing you want to learn (e.g. “Network Security Group”>
Enterprise Discovery
If you read my previous article you know I am annoyed at lazy IT architects that never create network architectural diagrams unless you waterboard them. (You are going to have to hold me under until I surrender before I will write them too.)
I also mentioned in the previous article that a company’s network design is like a snowflake; each of them is often a unique implementation so it is a little more difficult to make educated guesses than it would be for an on-premise environment.
And here is where you will be dazzled and amazed by Azure’s automated discovery.
Network Watcher
Network Watcher performs several functions and it would be worth your time to become very familiar. It is your source to enable netflow, pcap, and my favorite, the Network Security Group (NSG) Diagnostic tool. That last one will show you all the NSG rules (think “firewall”) that your data will flow through.

Architecture Diagram
If you navigate to the “Security Groups” page you will find “Resource Visualizer” on the left blade.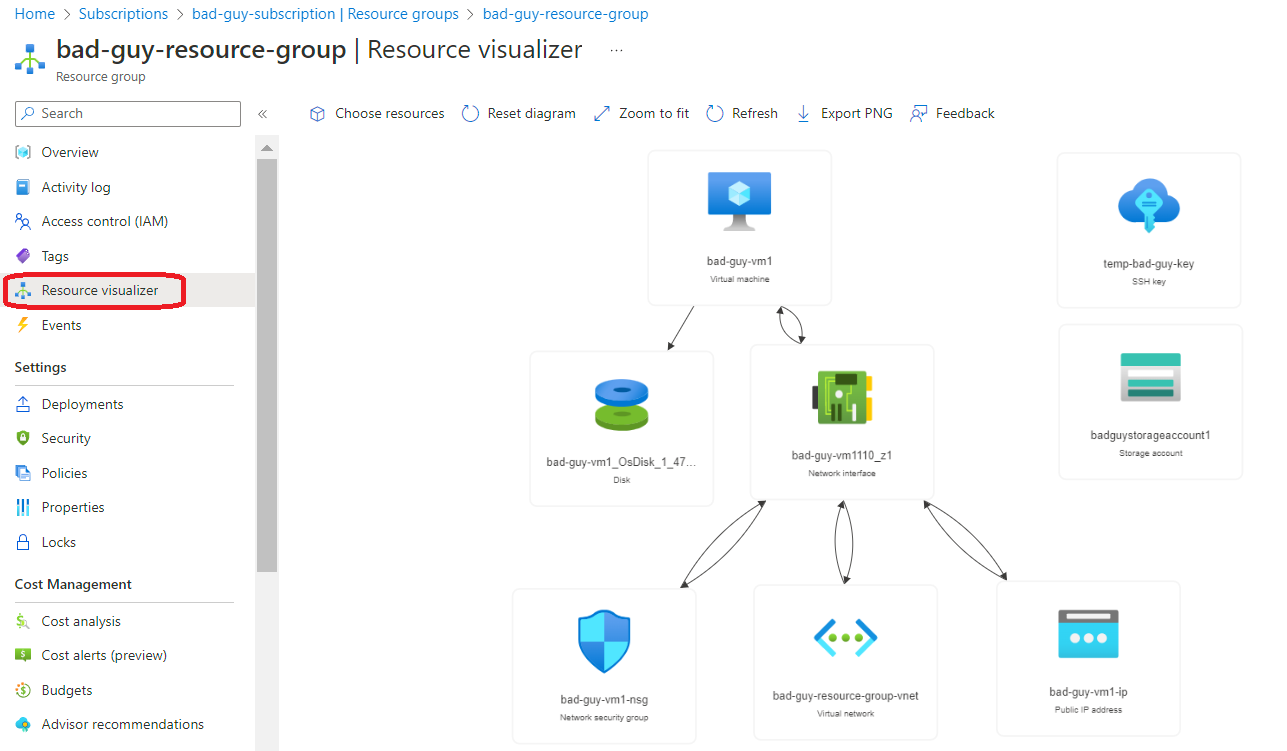
Network Forensics
We spend a lot of time in DFIR performing data manipulation prior to any data analysis. However, tools for log aggregation, normalization, and robust querying capability already exists within several Azure native security tools so I will include a breakdown of those first.
Additionally, as mentioned in Part I, I prefer to follow Phil Hagen’s FOR572 SANS Institute course, in which he focuses on the following network data sources:
1. Logs
2. NetFlow
3. Full Packet Capture (FPC)
Security Tools
Microsoft Defender for Cloud– Alerting, security assessment, and compliance of cloud resources
Microsoft Sentinel – Their SIEM/SOAR.
Azure Monitor – Telemetry-focused analysis and console for metrics or logs.
Microsoft Information Protection – M365 DLP solution
Microsoft 365 Defender – This rolled-up several legacy security consoles and is their single-pane-of-glass for M365, the Defender suite, and the Exchange Online stuff. M365 security tools and logging is an article all by itself and will not be covered here.
Vendor Tools – There are numerous third party tools that can be extensively leverages during an Incident Response. If the cloud environment is a mid-size or larger company it is highly likely it will have a third party vendor’s comprehensive network security visibility/compliance tool such as Palo Alto’s Prisma Cloud.
Logs
Microsoft refers to these data sources as “platform logs“. Their objective is to provide logs that can be injested by tools like AZ Monitor in order to perform fast queries using Log Analytics, or to export them with AZ Event Hub for event action or forwarding to a SIEM. All platform logs can also be downloaded from the portal or the AZ CLI into CSV or JSON.
Resource Logs
Resource logs capture operations performed IN or BY a cloud resource. These are not turned on by default, but should be. Resource log schema varies based on the resource type that it covers.
You will have to follow these instructions to activate them for export or analytics.
Example
Below are two examples of Resource logs created by the Microsoft team. You can find a breakdown of the fields here.
AZ Application Gateway log
{
    "resourceId": "/SUBSCRIPTIONS/{subscriptionId}/RESOURCEGROUPS/PEERINGTEST/PROVIDERS/MICROSOFT.NETWORK/APPLICATIONGATEWAYS/{applicationGatewayName}",
    "operationName": "ApplicationGatewayAccess",
    "time": "2017-04-26T19:27:38Z",
    "category": "ApplicationGatewayAccessLog",
    "properties": {
        "instanceId": "appgw_1",
        "clientIP": "191.96.249.97",
        "httpMethod": "GET",
        "requestUri": "/phpmyadmin/scripts/setup.php",
        "userAgent": "-",
        "httpStatus": 404,
        "httpVersion": "HTTP/1.0",
        "receivedBytes": 65,
        "sentBytes": 553,
        "timeTaken": 205,
        "sslEnabled": "off",
        "sslCipher": "",
        "sslProtocol": "",
        "serverRouted": "104.41.114.59:80",
        "serverStatus": "200",
        "serverResponseLatency": "0.023",
        "host": "www.contoso.com",
    }
}
AZ Application Firewall Log
{
  "resourceId": "/SUBSCRIPTIONS/{subscriptionId}/RESOURCEGROUPS/{resourceGroupName}/PROVIDERS/MICROSOFT.NETWORK/APPLICATIONGATEWAYS/{applicationGatewayName}",
  "operationName": "ApplicationGatewayFirewall",
  "time": "2017-03-20T15:52:09.1494499Z",
  "category": "ApplicationGatewayFirewallLog",
  "properties": {
    "instanceId": "ApplicationGatewayRole_IN_0",
    "clientIp": "104.210.252.3",
    "clientPort": "4835",
    "requestUri": "/?a=%3Cscript%3Ealert(%22Hello%22);%3C/script%3E",
    "ruleSetType": "OWASP",
    "ruleSetVersion": "3.0",
    "ruleId": "941320",
    "message": "Possible XSS Attack Detected - HTML Tag Handler",
    "action": "Blocked",
    "site": "Global",
    "details": {
      "message": "Warning. Pattern match \"<(a|abbr|acronym|address|applet|area|audioscope|b|base|basefront|bdo|bgsound|big|blackface|blink|blockquote|body|bq|br|button|caption|center|cite|code|col|colgroup|comment|dd|del|dfn|dir|div|dl|dt|em|embed|fieldset|fn|font|form|frame|frameset|h1|head|h ...\" at ARGS:a.",
      "data": "Matched Data: <script> found within ARGS:a: <script>alert(\\x22hello\\x22);</script>",
      "file": "rules/REQUEST-941-APPLICATION-ATTACK-XSS.conf",
      "line": "865"
    }
    "hostname": "40.90.218.100",
    "transactionId": "AYAcUqAcAcAcAcAcASAcAcAc"
  }
}
Activity Logs
Activity logs are subscription-level events which capture write operation (e.g. PUT, POST, DELETE) performed TO a cloud resource. That does not mean the Activity logs are logging the inbound request on a web app (i.e. access logging), but rather every request to manipulate the state of an AZ resource, such as a VM start/stop or the modification of the resource itself.
Azure portal --> All services --> search for Activity Log --> scroll down on the left-hand blade --> "the log source"Direct hyperlink if you are signed into your AZ Portal
Example
This is an example Activity log created by the Microsoft team. You can find a breakdown of the fields here. As you can see, fields like “authorization”, “caller”, “Name”, and “IPaddr” can be extremely valuable to your investigation.
{
    "authorization": {
        "action": "Microsoft.Network/networkSecurityGroups/write",
        "scope": "/subscriptions/<subscription ID>/resourcegroups/myResourceGroup/providers/Microsoft.Network/networkSecurityGroups/myNSG"
    },
    "caller": "[email protected]",
    "channels": "Operation",
    "claims": {
        "aud": "https://management.core.windows.net/",
        "iss": "https://sts.windows.net/1114444b-7467-4144-a616-e3a5d63e147b/",
        "iat": "1234567890",
        "nbf": "1234567890",
        "exp": "1234567890",
        "_claim_names": "{\"groups\":\"src1\"}",
        "_claim_sources": "{\"src1\":{\"endpoint\":\"https://graph.microsoft.com/1114444b-7467-4144-a616-e3a5d63e147b/users/f409edeb-4d29-44b5-9763-ee9348ad91bb/getMemberObjects\"}}",
        "http://schemas.microsoft.com/claims/authnclassreference": "1",
        "aio": "A3GgTJdwK4vy7Fa7l6DgJC2mI0GX44tML385OpU1Q+z+jaPnFMwB",
        "http://schemas.microsoft.com/claims/authnmethodsreferences": "rsa,mfa",
        "appid": "355249ed-15d9-460d-8481-84026b065942",
        "appidacr": "2",
        "http://schemas.microsoft.com/2012/01/devicecontext/claims/identifier": "10845a4d-ffa4-4b61-a3b4-e57b9b31cdb5",
        "e_exp": "262800",
        "http://schemas.xmlsoap.org/ws/2005/05/identity/claims/surname": "Robertson",
        "http://schemas.xmlsoap.org/ws/2005/05/identity/claims/givenname": "Rob",
        "ipaddr": "111.111.1.111",
        "name": "Rob Robertson",
        "http://schemas.microsoft.com/identity/claims/objectidentifier": "f409edeb-4d29-44b5-9763-ee9348ad91bb",
        "onprem_sid": "S-1-5-21-4837261184-168309720-1886587427-18514304",
        "puid": "18247BBD84827C6D",
        "http://schemas.microsoft.com/identity/claims/scope": "user_impersonation",
        "http://schemas.xmlsoap.org/ws/2005/05/identity/claims/nameidentifier": "b-24Jf94A3FH2sHWVIFqO3-RSJEiv24Jnif3gj7s",
        "http://schemas.microsoft.com/identity/claims/tenantid": "1114444b-7467-4144-a616-e3a5d63e147b",
        "http://schemas.xmlsoap.org/ws/2005/05/identity/claims/name": "[email protected]",
        "http://schemas.xmlsoap.org/ws/2005/05/identity/claims/upn": "[email protected]",
        "uti": "IdP3SUJGtkGlt7dDQVRPAA",
        "ver": "1.0"
    },
    "correlationId": "b5768deb-836b-41cc-803e-3f4de2f9e40b",
    "eventDataId": "d0d36f97-b29c-4cd9-9d3d-ea2b92af3e9d",
    "eventName": {
        "value": "EndRequest",
        "localizedValue": "End request"
    },
    "category": {
        "value": "Administrative",
        "localizedValue": "Administrative"
    },
    "eventTimestamp": "2018-01-29T20:42:31.3810679Z",
    "id": "/subscriptions/<subscription ID>/resourcegroups/myResourceGroup/providers/Microsoft.Network/networkSecurityGroups/myNSG/events/d0d36f97-b29c-4cd9-9d3d-ea2b92af3e9d/ticks/636528553513810679",
    "level": "Informational",
    "operationId": "04e575f8-48d0-4c43-a8b3-78c4eb01d287",
    "operationName": {
        "value": "Microsoft.Network/networkSecurityGroups/write",
        "localizedValue": "Microsoft.Network/networkSecurityGroups/write"
    },
    "resourceGroupName": "myResourceGroup",
    "resourceProviderName": {
        "value": "Microsoft.Network",
        "localizedValue": "Microsoft.Network"
    },
    "resourceType": {
        "value": "Microsoft.Network/networkSecurityGroups",
        "localizedValue": "Microsoft.Network/networkSecurityGroups"
    },
    "resourceId": "/subscriptions/<subscription ID>/resourcegroups/myResourceGroup/providers/Microsoft.Network/networkSecurityGroups/myNSG",
    "status": {
        "value": "Succeeded",
        "localizedValue": "Succeeded"
    },
    "subStatus": {
        "value": "",
        "localizedValue": ""
    },
    "submissionTimestamp": "2018-01-29T20:42:50.0724829Z",
    "subscriptionId": "<subscription ID>",
    "properties": {
        "statusCode": "Created",
        "serviceRequestId": "a4c11dbd-697e-47c5-9663-12362307157d",
        "responseBody": "",
        "requestbody": ""
    },
    "relatedEvents": []
}
Azure AD Logs
Azure AD logs capture AD Sign-ins, user changes, and flagged activity.
Azure portal --> All services --> search for Azure Active Directory --> scroll down on the left-hand blade --> Monitoring --> “the log source below”You can drill down to the following AD log subsets in the AZ portal:
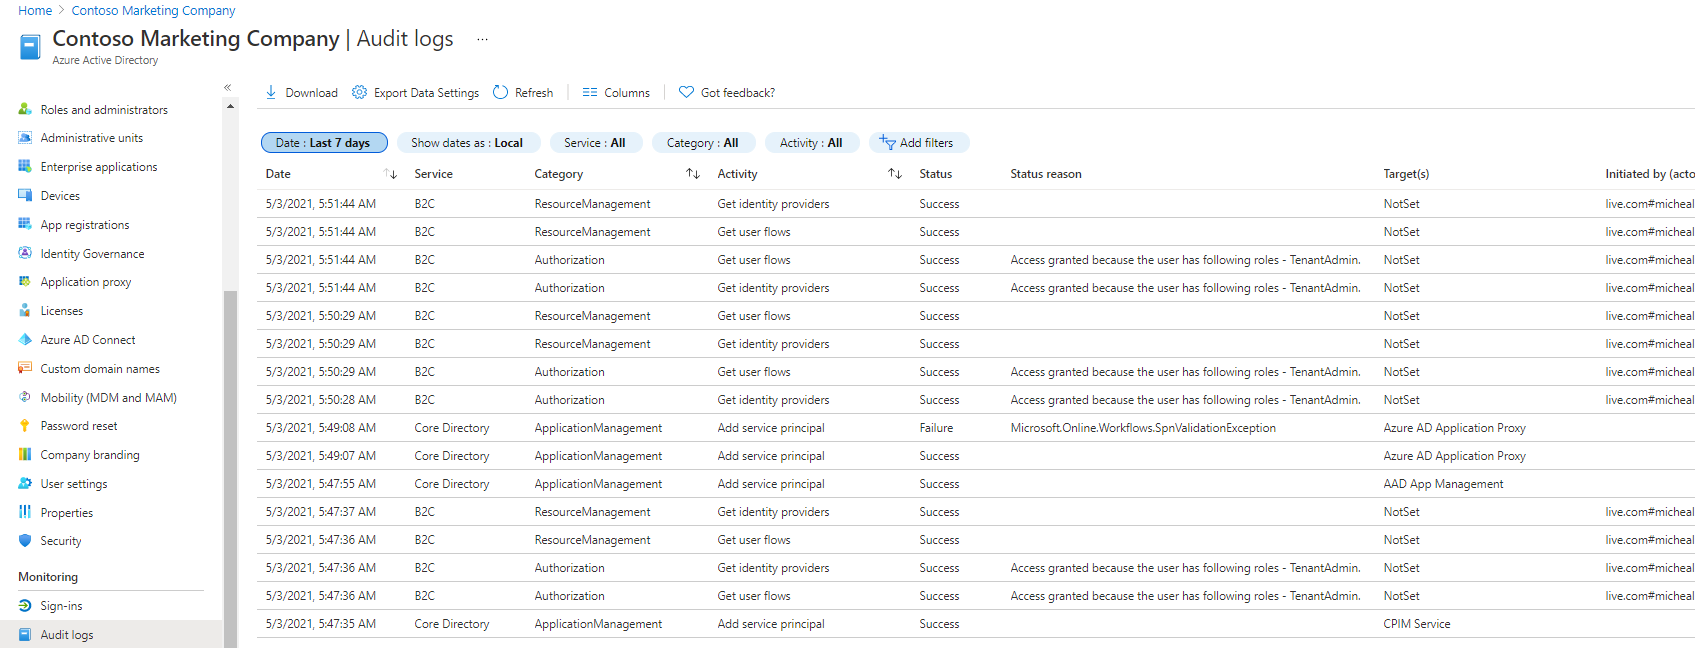
AD Audit Logs
AD Audit Logs capture AD tenant-based information such as user, group, credential and application changes.
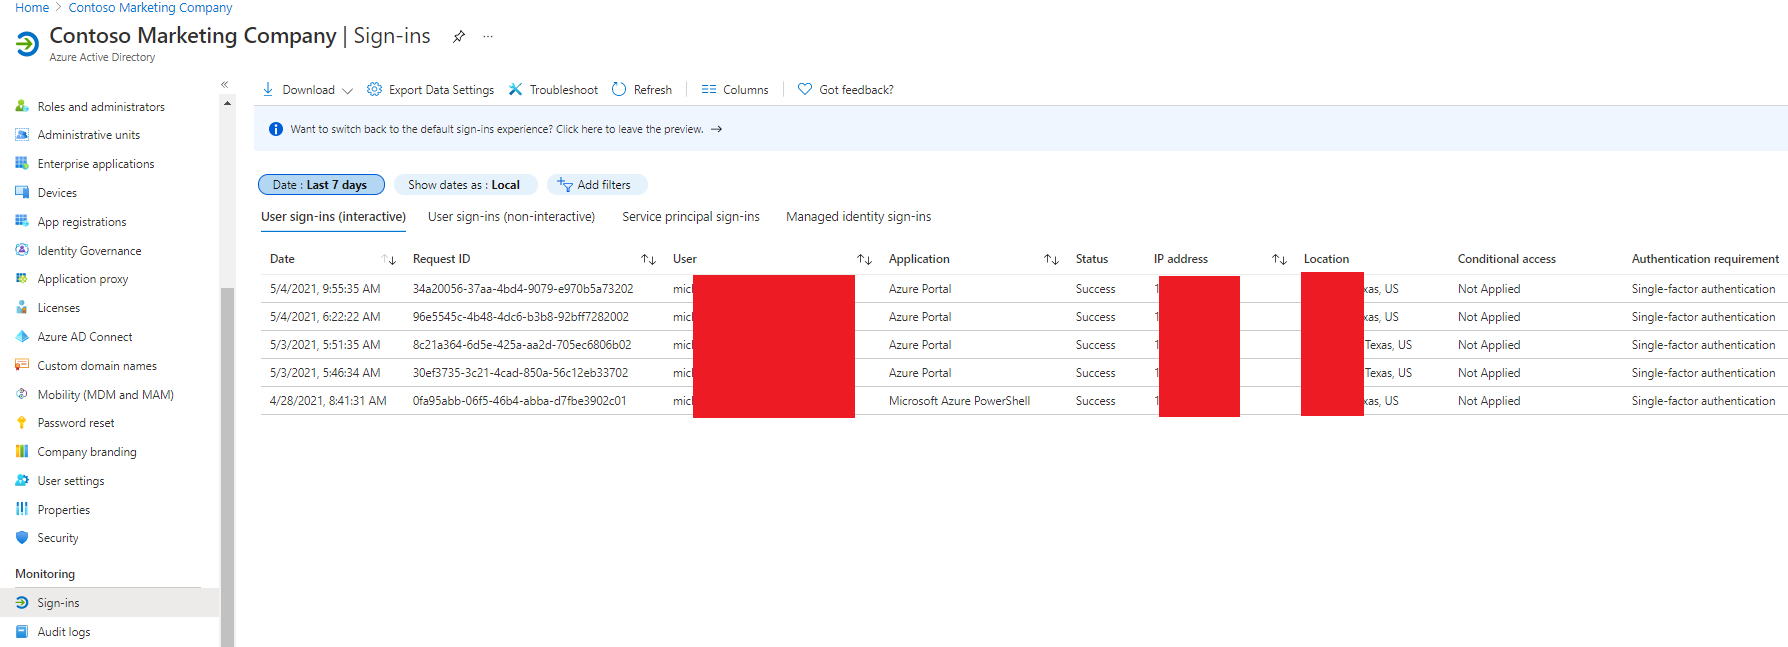
AD Sign-in Logs [Interactive]
AD Sign-in Logs [Interactive] captures user activity and status, such as MFA use, logon success/failures, destination, and IP geolocation. If you click on the details pane for any specific entry, you can gain more info, such as logon failure reason.
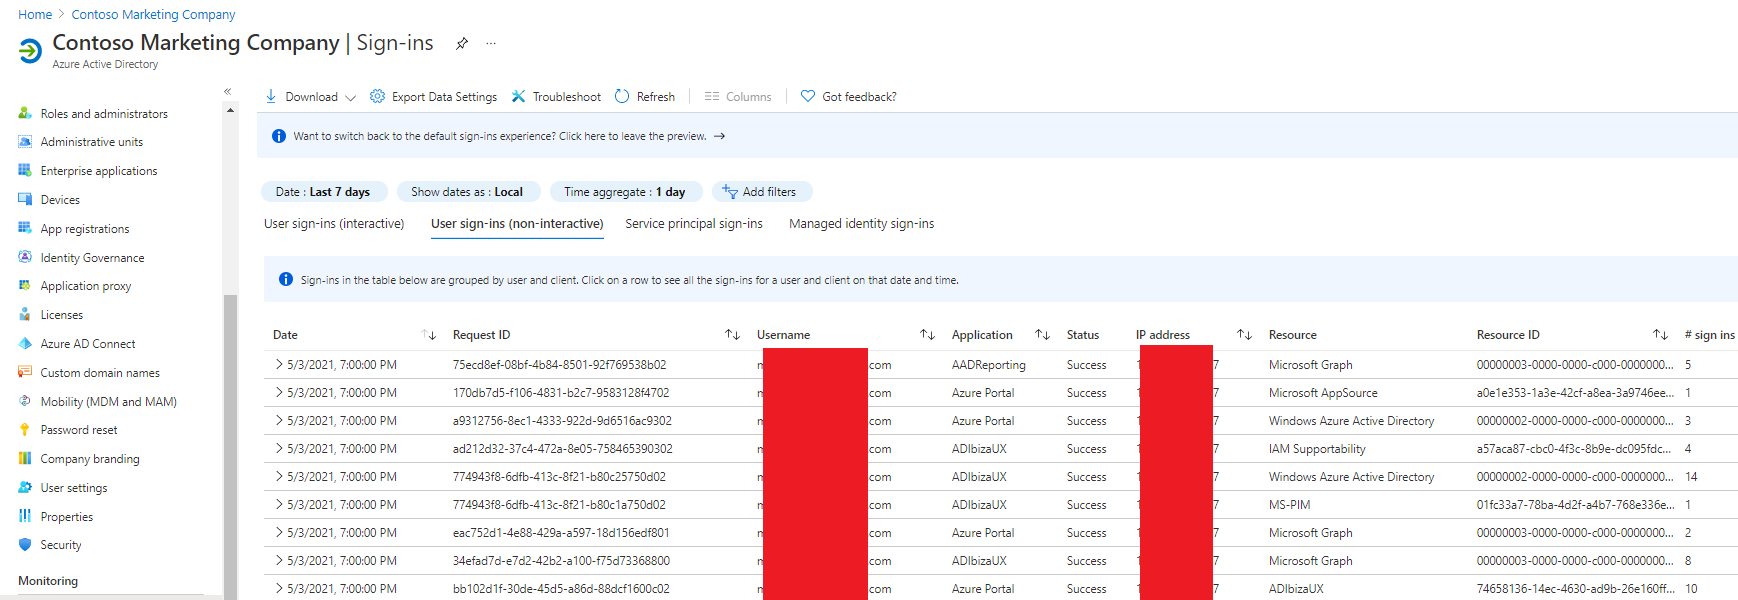
AD Sign-in Logs [Non-Interactive]
AD Provisioning Logs (Preview)
AD Provisioning Logs capture user/group provisioning in 3rd party applications, such as ServiceNow. This may be a good data source to identify lateral movement or establishment of a footprint.
NetFlow
NSG Flow Logs can be turned on within Network Watcher and pointed to a storage location of your choice. You will be required to:
- register Microsoft.Insights provider
- Azure portal –> All services –> search for Resource Providers –> microsoft.insights
- create a storage account in which to drop the logs
- Azure portal –> All services –> search for Storage –> Storage Account
- create a Log Analytics workstation to view them
- Azure portal –> All services –> search for Log Analytics Workspaces
- activate NSG flow logging
- Azure portal –> All services –> search for Network Watcher –> NSG Flow Logs
If you need to pivot in the data set quickly, recommend using Power BI, which can give you things like Top Talkers, and directionality.
Example Flow log
Path format: …\<region>\<YYYY>\<MM>\<DD>
Filename: (.gz)
<number>_vpcflowlogs_<region>_fl-<flow number>_<YYYYMMDD>T<UTC>Z_<hex>.logLog Example
version account-id interface-id srcaddr dstaddr srcport dstport protocol packets bytes start end action log-status

2 742822827437 eni-03aec391810141a74 172.12.10.50 139.11.192.2 40048 443 6 10 1673 1611943565 1611943577 ACCEPT OK
2 742822827437 eni-03aec391810141a74 139.11.192.2 172.12.10.50 443 40050 6 20 22015 1611943565 1611943577 ACCEPT OK
2 742822827437 eni-03aec391810141a74 172.31.11.50 151.1.50.8 38196 443 6 98 6278 1611943565 1611943577 ACCEPT OK
2 742822827437 eni-03aec391810141a74 151.1.50.8 172.31.11.50 443 40042 6 110 153235 1611943565 1611943577 ACCEPT OK
Full Packet Capture (FPC)
Network Watcher – FPC between Network Security Groups
Azure portal –> All services –> search for Network Watcher –> Network Diagnostic Tools –> Packet Capture
Follow these instructions to start/stop/download/delete the captures
Coinminer?
Azure portal –> All services –> search for Network Watcher –> Logs –> Diagnostic Logs
Enable Network Watcher’s diagnostic log to check system metrics. Instructions are here.
Host Forensics
I felt there was a lack of concise, publicly-available information on this part so I wanted to get the basics out there and expand on the steps over time. However, these options are evolving quickly so if someone has better information please feel free to let me know!
Acquiring an Azure VM disk image
Make sure you understand the volume encryption question before you try a lot of this.
These are some of your available choices:
- Use libcloudforensics
- Forensic Disk Copies in Azure – Amazing and fast once it is customized for your environment. Recommending this as your primary workflow.
- Use a DFIR tool
- many of them do not see a difference with a cloud volume
- Get admin credentials from the cloud admin
- Have the cloud admin get a snapshot and send it to you
- Have the admin follow the steps above.
- Make sure the cloud admin understands you are not going to use this disk to create a clone in the same way system administrators would typically create clones. You only want a full snapshot of the disk made available to your DFIR subscription/resource group/etc.
- Acquire the VHD using Azure Storage Explorer
- AZ Storage Explorer is an amazing tool build by Microsoft. It can download full disk images as a VHD using a Microsoft purpose-built protocol optimized for transfer speed.
- Storage Explorer to Manage Disks
- Peer your DFIR resource group to the infected one
- Follow the instructions in the below section, “Extra Stuff –> How to Peer your Forensic VNet to the Bad VNet”
- ensure there is no overlapping IP ranges
- make sure you’ve got strong traffic controls
- If the route is open, you should be able to use your DFIR cloud workstation as if it is in your subnet. (I have not tried this one yet.)
Automation
For Alert-to-HostDataAcquisition, I recommend reading Microsoft’s “Get-ForensicVM” workflow. Or consider an XDR/DFIR vendor tool.
Exporting the VHD from the cloud
I highly recommend performing cloud DFIR using a cloud forensic workstation. The amount of time and effort when forcing cloud resources into the standard on-prem DFIR analysis workflow can be staggering. Moreover, this will be a time-consuming copy unless you have ExpressRoute Premium.
The following choices assume you 1) want to do the forensic analysis on-prem and 2) have not (yet) created and sync’d an Azure File Server between your cloud DFIR environment and your on-prem forensic workstations.
- Best choice – Azure Storage Explorer
- Read section, “Copy a Managed Disk“. My recommendation is to get administrative credentials at the subscription-level; it is a good balance between ease of data access and security. With subscription-level access you can use AZ Storage Explorer to simply download the unattached VHD, assuming it is not currently attached to a VM. If the VHD is still attached to a VM, you should use the snaphot workflow. With that same access, you can also download the platform logs if they are being archived to an AZ storage account within that subscription, which is very likely if the company is storing the logs at all.
- Use a Shared Access Signature for access control. Follow the SAS creation instructions in section, “Generate a Download URL”
- Another option – Download VHD (custom URL)
- Snapshot the VHD – Windows or Linux
- Forensicator’s decision point on whether to power down the VM or not.
- Use a Shared Access Signature for access control. Follow the SAS creation instructions in section, “Generate a Download URL”
- Slowest option – Shipping it
- Ship it with Azure Import/Export
Automation
For Automation of your acquired data –> your on-prem file server, I recommend creating a Azure File server (NFS or SMB) and use Azure FileSync. Cold tier for both your “DFIR Tools/Binaries” and the “Closed cases”; hot tier for your active cases.
Make a copy of the VHD
After you have the vm’s disk in your cloud storage somewhere, follow only the steps in section, “Copy a Disk” to create a VHD copy.
Data Analysis
- Attach the VHD to your cloud forensic workstation but do not mount it. If on-prem, use your typical analysis workflow on the VHD you exported. My preference for:
- triage data
- mounting the VHD read-only with Arsenal Image Mounter and running KAPE
- deep-dive forensics
- add the VHD to X-Ways Forensic, Magnet Axiom, or SIFT Workstation
- Network Forensics
- SOF-ELK all day.
- triage data
- If possible, for cloud DFIR workstations I recommend separate disks. However, do some research to determine if they are actually separate physical disks. If they are logical, the performance increase might not be worth the cost.
- Workstation Disks
- PremiumSSD = OS and hash library
- PremiumSSD = Cases disk
- Ultra Disk = forensic tool I/O temp cache
- Azure Files (File Server)
- NFS/SMB share #1 (hot tier) – DFIR team import/export for active cases
- NFS/SMB share #2 (cold tier) – uninstalled DFIR tools/binaries archive
- NFS/SMB share #1 (cold/archive tier) – archived closed cases
- Workstation Disks
What if I have a large number of files or a bunch of images?
| Dataset | Network bandwidth | Solution to use |
| Large dataset | Low-bandwidth network or direct connectivity to on-premises storage is limited by organization policies | Azure Import/Export for export; Data Box Disk or Data Box for import where supported; otherwise use Azure Import/Export |
| Large dataset | High-bandwidth network: 1 gigabit per second (Gbps) – 100 Gbps | AZCopy for online transfers; or to import data, Azure Data Factory, Azure Data Box Edge, or Azure Data Box Gateway |
| Large dataset | Moderate-bandwidth network: 100 megabits per second (Mbps) – 1 Gbps | Azure Import/Export for export or Azure Data Box family for import where supported |
| Small dataset: a few GBs to a few TBs | Low to moderate-bandwidth network: up to 1 Gbps | If transferring only a few files, use Azure Storage Explorer, Azure portal, AZCopy, or AZ CLI |
Extra Stuff
All of this was gleaned from the excellent Microsoft Learn practice sandboxes or by running it on my own AZ subscription.
How to Navigate in AZ CLI
Unfortunately, a full AZ Powershell, AZ CLI, and Bash AZ tutorial is outside the scope of this article. But here are a few pointers that may help.
(NOTE:”-h” switch is a scoped help menu)
How to find all the Azure commands (Powershell)
This will display all the “get” commands for Azure AD.
Change it to “get*az*” and it will show ALL of the AZ get commands.
> get-command get*azad*OUTPUT
CommandType     Name         Version                                 Source
-----------     ----          -------                                ------
Alias           Get-AzADServicePrincipalCredential       3.4.1      Az.Resources
Cmdlet          Get-AzADAppCredential                    3.4.1      Az.Resources
Cmdlet          Get-AzADApplication                      3.4.1      Az.Resources
Cmdlet          Get-AzADGroup                            3.4.1      Az.Resources
Cmdlet          Get-AzADGroupMember                      3.4.1      Az.Resources
Cmdlet          Get-AzADServicePrincipal                 3.4.1      Az.Resources
Cmdlet          Get-AzADSpCredential                     3.4.1      Az.Resources
Cmdlet          Get-AzADUser                             3.4.1      Az.Resources
Cmdlet          Get-AzAdvisorConfiguration               1.1.1      Az.Advisor
Cmdlet          Get-AzAdvisorRecommendation              1.1.1      Az.Advisor
Drilling down to “user” stuff
> get-command *azaduser*OUTPUT
CommandType    Name          Version    Source
-----------    ----          -------    ------
Alias        Set-AzADUser    3.4.1    Az.Resources
Cmdlet       Get-AzADUser    3.4.1    Az.Resources
Cmdlet       New-AzADUser    3.4.1    Az.Resources
Cmdlet       Remove-AzADUser 3.4.1    Az.Resources
Cmdlet       Update-AzADUser 3.4.1    Az.Resources
Want to list the users? (I only have one user)
> get-azaduserOUTPUT
UserPrincipalName : JohnSmith_hotmail.com#EXT#@JohnSmithhotmail.onmicrosoft.com
ObjectType : User
UsageLocation : US
GivenName : John
Surname : Smith
AccountEnabled : True
MailNickname : JohnSmith_hotmail.com#EXT#
Mail :
DisplayName : John Smith
Id : 543dfbdf-d3d5-3a4d-7cde-645ea5dc22fc
Type : Member
What other query-able information does the object have?
> get-azaduser | get-member -type propertyOUTPUT (of my instance, anyway)
   TypeName: Microsoft.Azure.Commands.ActiveDirectory.PSADUser


Name              MemberType Definition
----              ---------- ----------
AccountEnabled    Property   System.Nullable[bool] AccountEnabled {get;set;}
DisplayName       Property   string DisplayName {get;set;}
GivenName         Property   string GivenName {get;set;}
Id                Property   string Id {get;set;}
Mail              Property   string Mail {get;set;}
MailNickname      Property   string MailNickname {get;set;}
ObjectType        Property   string ObjectType {get;}
Surname           Property   string Surname {get;set;}
Type              Property   string Type {get;set;}
UsageLocation     Property   string UsageLocation {get;set;}
UserPrincipalName Property   string UserPrincipalName {get;set;}
Need only one of the user properties? (I added a few fake users to make it less boring)
> get-azaduser | select DisplayNameOUTPUT
DisplayName
-----------
John Smith
Jerry Smith
Daniel Bucket
Terrance Atwater
What commands are available to get a volume snapshot
>get-command *snapshot*OUTPUT
> get-command *snapshot*

CommandType     Name                                         Version    Source
-----------     ----                                         -------    ------
Function        New-VirtualDiskSnapshot                      2.0.0.0    Storage
Cmdlet          Get-AzSnapshot                               4.1.0      Az.Compute
Cmdlet          Get-AzWebAppSnapshot                         1.9.0      Az.Websites
Cmdlet          Grant-AzSnapshotAccess                       4.1.0      Az.Compute
Cmdlet          New-AzSnapshot                               4.1.0      Az.Compute
Cmdlet          New-AzSnapshotConfig                         4.1.0      Az.Compute
Cmdlet          New-AzSnapshotUpdateConfig                   4.1.0      Az.Compute
Cmdlet          Remove-AzSnapshot                            4.1.0      Az.Compute
Cmdlet          Restore-AzWebAppSnapshot                     1.9.0      Az.Websites
Cmdlet          Revoke-AzSnapshotAccess                      4.1.0      Az.Compute
Cmdlet          Set-AzSnapshotDiskEncryptionKey              4.1.0      Az.Compute
Cmdlet          Set-AzSnapshotImageReference                 4.1.0      Az.Compute
Cmdlet          Set-AzSnapshotKeyEncryptionKey               4.1.0      Az.Compute
Cmdlet          Set-AzSnapshotUpdateDiskEncryptionKey        4.1.0      Az.Compute
Cmdlet          Set-AzSnapshotUpdateKeyEncryptionKey         4.1.0      Az.Compute
Cmdlet          Update-AzSnapshot                            4.1.0      Az.Compute
This all works in Bash too
List VM status
> az vm list --output tableOUTPUT
Name       ResourceGroup   Location   Zones
---------- --------------- ---------- -------
webServer1 TEST-RG2-EASTUS eastus
webServer2 TEST-RG2-EASTUS eastus
With extra details
>az vm list --output table --show-detailsOUTPUT
Name       ResourceGroup    PowerState   PublicIps  Fqdns   Location   Zones
---------- --------------- ------------ ----------- ------- ---------- -------
webServer1 TEST-RG2-EASTUS VM running                       eastus
webServer2 TEST-RG2-EASTUS VM running                       eastus
You can grep the output
az ad user list
OUTPUT
[
  {
    "accountEnabled": true,
    ...
    ...
    "createdDateTime": "2020-03-31T16:00:44Z",
    ...
    ...
    "displayName": "Mike Test",
    ...
    ...
    "streetAddress": null,
    "userPrincipalName": "[email protected]",
    "userState": null,
    "userStateChangedOn": null,
    "userType": "Member"
  }
]
With grep
> az ad user list | grep street
OUTPUT
"streetAddress": null,
"streetAddress": null,
How to Use Variables in AZ CLI to speed up your typing
Use the Azure CLI
Populating the NIC ID into a variable
For any AZ command, use the “list” function which should produce the JSON output of that object. From there, look at the parent/children relationship of the list and query that value like the example below.
> NICID=$(az vm nic list \
--resource-group <MyResourceGroup> \
--vm-name <MyVM> \
--query "[].virtualMachine.network.publicIpAddresses[*].ipAddress" \
--output tsv)
Or
NICNAME=$(az vm nic show \
--resource-group <MyResourceGroup> \
--vm-name nva \
--nic $NICID \
--query "{name:name}" --output tsv)
OUTPUT
> echo $NICNAME

> /subscriptions/<GUID>/resourceGroups/MyResourceGroup \
/providers/Microsoft.Network/networkInterfaces/<NIC ID>
or get the PublicIP of an NVA that was created:
> NVAIP="$(az vm list-ip-addresses \
--resource-group <MyResourceGroup> \
--name nva \</p>
--query "[].virtualMachine.network.publicIpAddresses[*].ipAddress" \
--output tsv)"
OUTPUT
138.91.224.150then you can remotely fire a commands like this:
IP forwarding
ssh -t -o StrictHostKeyChecking=no \
azureuser@$NVAIP 'sudo sysctl \
-w net.ipv4.ip_forward=1; exit;'
checking routing
ssh -t -o StrictHostKeyChecking=no \
azureuser@$PUBLICIP 'traceroute <vm name> \
--type=icmp; exit'
OUTPUT
traceroute to private.mr3m5zhwg0muhk40lfk0h1vx1c.dx.internal.cloudapp.net (10.0.1.4), 64 hops max
10.0.2.4 0.815ms 0.422 0.396ms
10.0.1.4 1.211ms 1.031ms 1.119ms
Connection to 104.42.226.143 closed.
Azure Bastion (cloud jumpboxes)
Is the client using a AZ Bastion host?
The Bastion should be listed in:
AZ portal --> AZ Bastions“Current Session Monitoring” allows you to view sessions and force disconnects.
To disconnect a session:

AZ portal --> Resource groups --> RG Name --> VNet --> Sessions
AZ Bastion audit logs may be turned on.
Find out where their log storage account is pointed and look for the Insight logs.
Example of a Bastion host JSON audit log.
{
"time":"2020-10-22T23:26:00.697Z",
"resourceId":"/SUBSCRIPTIONS/<subscripionID>/RESOURCEGROUPS/MYBASTION/PROVIDERS/MICROSOFT.NETWORK/BASTIONHOSTS/MYBASTION-BASTION",
"operationName":"Microsoft.Network/BastionHost/connect",
"category":"BastionAuditLogs",
"level":"Informational",
"location":"westus2",
"properties":{
   "userName":"<username>",
   "userAgent":"Mozilla/5.0 (Windows NT 10.0; Win64; x64) AppleWebKit/537.36 (KHTML, like Gecko) Chrome/77.0.3865.90 Safari/537.36",
   "clientIpAddress":"121.111.169.12",
   "clientPort":24039,
   "protocol":"ssh",
   "targetResourceId":"/SUBSCRIPTIONS/<subscripionID>/RESOURCEGROUPS/MYBASTION/PROVIDERS/MICROSOFT.COMPUTE/VIRTUALMACHINES/LINUX-KEY",
   "subscriptionId":"<subscripionID>",
   "message":"Successfully Connected.",
   "resourceType":"VM",
   "targetVMIPAddress":"172.11.1.4",
   "tunnelId":"<tunnelID>"
},
"FluentdIngestTimestamp":"2020-10-22T23:26:00.0000000Z",
"Region":"westus2",
"CustomerSubscriptionId":"<subscripionID>"
Getting an Endpoint’s “Effective Route”
This is useful if you need to understand the routing path or if you want to see if traffic was allowed to/from an endpoint. If you look at the NIC itself, you can see its “Effective route”
AZ portal --> Routing Tables --> Effective route OUTPUT – ROUTING TABLE
w/o “service endpoint” enabled
SOURCE  STATE   ADDRESS PREFIXES  NEXT HOP TYPE
Default Active  10.1.1.0/24          VNet
Default Active  0.0.0.0./0         Internet
Default Active  10.0.0.0/8           None
Default Active  100.64.0.0./10       None
Default Active  192.168.0.0/16       None
w/ “service endpoint” enabled
SOURCE   STATE  ADDRESS PREFIXES NEXT HOP TYPE
Default Active  10.1.1.0/24      VNet
Default Active  0.0.0.0./0      Internet
Default Active  10.0.0.0/8       None
Default Active  100.64.0.0./10   None
Default Active  192.168.0.0/16   None
Default Active  20.38.106.0/23, 10 more VirtualNetworkServiceEndpoint
Default Active  20.150.2.0/23, 9 more VirtualNetworkServiceEndpoint
How to Peer your Forensic VNet to the Bad VNet
These instructions use the Azure CLI, which is available from the Azure Portal or as a local plugin. Before trying to “one-off” this, I recommend scripting some of the variables below for future use. Again, huge thanks to the Microsoft team for creating such excellent training; what follows comes from their general VNet peering training.
Create the peering connections
Get credentials for the target VNet and make sure the IP ranges do not overlap
From the 1st side
az network vnet peering create \
--name <Your DfirVnet>-To-<TargetVNet> \
--remote-vnet <TargetVNet> \
--resource-group $rg \
--vnet-name <Your DfirVnet> \
--allow-vnet-access
From the 2nd side
az network vnet peering create \
--name <TargetVNet>-To-<Your DfirVnet>\
--remote-vnet <Your DfirVnet> \
--resource-group <their RG> \
--vnet-name <Their Vnet name> \
--allow-vnet-access
Check the peering connection
az network vnet peering list \
--resource-group $rg \
--vnet-name <Your DfirVnet> \
--output table
OUTPUT
AllowForwardedTraffic AllowGatewayTransit AllowVirtualNetworkAccess Name PeeringState ProvisioningState ResourceGroup UseRemoteGateways
----------------------- -----
False False True DfirVnet-To-<TargetVNet> Connected Succeeded $rg False
False False True <TargetVNet>-To-DfirVnet Connected Succeeded $rg False
Check the routes:
az network vnet peering list \
--resource-group $rg \
--vnet-name <TargetVNet> \
--output table
OUTPUT
AllowForwardedTraffic AllowGatewayTransit AllowVirtualNetworkAccess Name PeeringState ProvisioningState ResourceGroup UseRemoteGateways
----------------------- -----
False False True <TargetVNet>-To-DfirVnet Connected Succeeded $rg False
False False True DfirVnet-To-<TargetVnet> Connected Succeeded $rg False
Check the NIC route
az network nic show-effective-route-table \
--resource-group learn-fde51b5b-e7c9-4d07-b4e1-8b7e22aefb67 \
--name <DfirVM NIC> \
--output table
OUTPUT
Source   State Address Prefix Next Hop Type Next Hop IP
-------- ------- ---------------- ----------------- -------------
Default  Active <cidr> VnetLocal
Default  Active <cidr> VNetPeering
Default  Active <cidr> Internet
Default  Active <cidr> None
Default  Active <cidr> None
Default  Active <cidr> None
Default  Active <cidr> None
Default  Active <cidr> None
Default  Active <cidr> VNetGlobalPeering
Check the routing by SSH’ing into the VM’s. Confirm SSH/RDP is open first, of course. Read the “How to Build a Cloud Forensic Environment” below to get an idea of traffic rule creation.
In Powershell:
"test-netconnection -computername <target host> -port <port>
(Back to your AZ CLI) List the VM’s and routes
az vm list \
--resource-group <RG. Or the var you assigned $rg> \
--query "[*].{Name:name, PrivateIP:privateIps, PublicIP:publicIps}" \
--show-details \
--output table
OUTPUT
Name PrivateIP PublicIP
----------- ----------- --------------
DfirVM1 <PrivateIP> <PublicIP>
...
...
Assign the public IP to a variable for ease of use
PUBLICIP="$(az vm list-ip-addresses \
--resource-group $rg \
--name \
--query "[].virtualMachine.network.publicIpAddresses[*].ipAddress" \
--output tsv)"
Check the SSH connection
ssh -o StrictHostKeyChecking=no <USERNAME>@<IP>Then SSH from that one, to another (on the private IP) and see if it works
How To Create a Site-To-Site VPN
TODO
How to Build a Cloud Forensic Workstation
Build the DFIR VNet
List and Chose the location for VNet
>az account list-locations -o tableOUTPUT
DisplayName           Latitude    Longitude    Name
--------------------  ----------  -----------  ------------------
East Asia             22.267      114.188      eastasia
Southeast Asia        1.283       103.833      southeastasia
Central US            41.5908     -93.6208     centralus
East US               37.3719     -79.8164     eastus
East US 2             36.6681     -78.3889     eastus2
West US               37.783      -122.417     westus
North Central US      41.8819     -87.6278     northcentralus
South Central US      29.4167     -98.5        southcentralus
North Europe          53.3478     -6.2597      northeurope
West Europe           52.3667     4.9          westeurope
Japan West            34.6939     135.5022     japanwest
Japan East            35.68       139.77       japaneast
Brazil South          -23.55      -46.633      brazilsouth
Australia East        -33.86      151.2094     australiaeast
Australia Southeast   -37.8136    144.9631     australiasoutheast
South India           12.9822     80.1636      southindia
Central India         18.5822     73.9197      centralindia
West India            19.088      72.868       westindia
Jio India West        22.470701   70.05773     jioindiawest
Canada Central        43.653      -79.383      canadacentral
Canada East           46.817      -71.217      canadaeast
UK South              50.941      -0.799       uksouth
UK West               53.427      -3.084       ukwest
West Central US       40.890      -110.234     westcentralus
West US 2             47.233      -119.852     westus2
Korea Central         37.5665     126.9780     koreacentral
Korea South           35.1796     129.0756     koreasouth
France Central        46.3772     2.3730       francecentral
France South          43.8345     2.1972       francesouth
Australia Central     -35.3075    149.1244     australiacentral
Australia Central 2   -35.3075    149.1244     australiacentral2
UAE Central           24.466667   54.366669    uaecentral
UAE North             25.266666   55.316666    uaenorth
South Africa North    -25.731340  28.218370    southafricanorth
South Africa West     -34.075691  18.843266    southafricawest
Switzerland North     47.451542   8.564572     switzerlandnorth
Switzerland West      46.204391   6.143158     switzerlandwest
Germany North         53.073635   8.806422     germanynorth
Germany West Central  50.110924   8.682127     germanywestcentral
Norway West           58.969975   5.733107     norwaywest
Norway East           59.913868   10.752245    norwayeast
Brazil Southeast      -22.90278   -43.2075     brazilsoutheast
West US 3             33.448376   -112.074036  westus3
Create variables for RG and Location, then create the RG
Assuming you have a Resource Group named “DfirResourceGroup”. But don’t overlap your target RG’s IP range like I do below…
> rg=DfirResourceGroup

> location=<location you want>

> az network vnet create \
--resource-group $rg \
--name DfirVnet \
--address-prefix 10.0.0.0/16 \
--subnet-prefix 10.0.0.0/24 \
--subnet-name DfirSubnet1 \
--location $location \
OUTPUT
az group list -o table

Name                                Location        Status
----------------------------------  --------------  ---------
DfirResourceGroup                   southcentralus  Succeeded
NetworkWatcherRG                    southcentralus  Succeeded
Create the DFIR VNet and subnet.
This one is also creating a subnet, which I recommend if you intend to ever peer an infected VNet to your DFIR VNet. This way you can control the traffic between your forensic workstations and the infected endpoints.
> az network vnet create \
--resource-group $rg \
--name DfirVnet\
--address-prefix 10.0.0.0/16 \
--subnet-name DfirSubnet  \
--subnet-prefix 10.0.0.0/24 \
--location $location
Verify the network and subnet were created
$ az network vnet list -o table


Name      ResourceGroup      Location        NumSubnets  Prefixes     DnsServers    DDOSProtection
--------  -----------------  --------------  ----------  -----------  -----------  ---------------
DfirVnet  DfirResourceGroup  southcentralus  1             10.0.0.0/16                False


$ az network vnet subnet list -g $rg --vnet-name DfirVnet -o table


AddressPrefix  Name         Priv..Pol..  Priv..Serv..Pol..  ProvisioningState   RG
-----------    -----------  --------------  --------------  -----------------   -----
10.0.0.0/24    DfirSubnet1  Enabled         Enabled         Succeeded           DfirResourceGroup
Create the Network Security Group (NSG)
az network nsg create \
--resource-group $rg \
--name DfirNsg
OUTPUT
~$ az network nsg list -o table
Location        Name     ProvisioningState    ResourceGroup      ResourceGuid
--------------  -------  -------------------  -----------------  ----------------------
southcentralus  DfirNsg  Succeeded            DfirResourceGroup  <resource GUID>
Creating NSG rules (allow SSH)
create whatever rules you need to customize to your environment. These two is just an example.
az network nsg rule create \
--resource-group $rg \
--nsg-name \
--name AllowSSHRule \
--direction Inbound \
--priority 100 \
--source-address-prefixes <source IP range> \
--destination-address-prefixes <dest IP range> \
--destination-port-ranges 22 \
--access Allow \
--protocol Tcp \
--description "Allow inbound SSH"
Hardening – Creating Deny Rules
> az network nsg rule create \
--resource-group $rg \
--nsg-name DfirNsg \
--name Deny_Internet \
--direction Outbound \
--priority 200 \
--source-address-prefixes 10.0.0.0\24 \
--source-port-ranges '*' \
--access Deny \
--protocol '*' \
--description "Deny access to Internet"
NOTE: This is good time to mention the basic command to view NSG rules
$ az network nsg rule list \
--resource-group $rg \
--nsg-name DfirNsg \
-o table
OUTPUT
[I abbreviated for readability and removed the Application Security Group (ASG) header info since it is not relevant in this example]
Name          ResourceGroup      Pri  SrcPorts SrcAddrPref Access Prot Dir DstPorts  DstAddrPref
-------------  ----------------
AllowSSHRule  DfirResourceGroup  100  *  10.0.0.024 Allow Tcp Inbound 80  10.0.0.024  None
Deny_Internet DfirResourceGroup  200  *  10.0.0.024 Deny  *   Outbound 80 *           None
Create a Storage account
> az storage account create \
--resource-group $rg
--name <DfirStorageAccount>
--sku <e.g. Standard_LRS>
Store the primary key in a variable
> test=$(az storage account keys list \
> -g $rg \
> --account-name <DfirStorageAccount> \
> --query "[0].value" |tr -d "\"")
Create a file share
> az storage share create \
--account-name <DfirStorageAccount> \
--account-key $STORAGEKEY \
--name "dfirfileshare"
OUTPUT
$ az storage share list --account-key $STORAGEKEY --account-name yourincidentnumber -o table

Name           Quota    Last Modified
-------------  -------  -------------------------
dfirfileshare  5120     2021-05-06T20:00:54+00:00
Restrict file share access to only your network and only on the AZ backbone (no Internet access)
# This assigns the Microsoft.Storage endpoint to the subnet

az network vnet subnet update \
    --vnet-name DfirVnet \
    --resource-group $rg \
    --name DfirSubnet1 \
    --service-endpoints Microsoft.Storage

# This is an explicit deny making the storage account inaccessible

az storage account update \
--resource-group $rg \
--name $STORAGEACCT \
--default-action Deny

# This is an explicit accept for only your vnet

az storage account network-rule add \
--resource-group $rg \
--account-name $STORAGEACCT \
--vnet <your vnet> \
--subnet <your subnet>
Create your forensic VM
Will expand this section later to include AZ CLI-based VM creation. For now, pick the VM that applies to your use case.
AZ portal --> Virtual Machines Check the forensic VM (or use the watch command next)
az vm list \
--resource-group $rg \
--show-details \
--query "[*].{Name:name, Provisioned:provisioningState, Power:powerState}" \
--output table
OUTPUT
Name         Provisioned   Power
----------   ------------- ----------
DfirVM1      Succeeded VM  running
Or watch the VM’s get spun up
watch -d -n 5 "az vm list \
--resource-group $rg \
--show-details \
--query '[*].{Name:name, ProvisioningState:provisioningState, PowerState:powerState}' \
--output table"
How To Leverage CosmosDB for DFIR
TODO
Citations
All screenshots and quotes originate from docs.microsoft.com or my personal Azure cloud subscription.